

Observability · Security · AI
AI-Powered
Observability
and Security
30x cheaper than Datadog. Predictable pricing.
Exceptional customer support.
Datadog bill too high? Migrate today, the rest of your contract is on us. Migration assistance and bespoke onboarding included. Book a consultation
12 ms
P99
0.02%
Errors
4.2k
RPS
Tracing · Spans
38 ms totalChoose your deployment model
Cloud Solution
RecommendedFully managed by obseria.io. Zero infrastructure overhead — connect your first service in under 5 minutes. Automatic updates, 99.99% uptime SLA, global multi-region.
- 14-day free trial, no credit card
- EU & US regions available
- SOC 2 Type II · ISO 27001
Dedicated · On-Premises
EnterpriseDeploy obseria.io Composer on your own infrastructure — Kubernetes, bare-metal, or private cloud. Full data sovereignty, air-gap support, and custom retention policies.
- Helm chart · Docker Compose included
- Data never leaves your network
- SSO, SAML, custom RBAC


























Platform · AI · Observability
From Logging That Just Works
to Full Observability
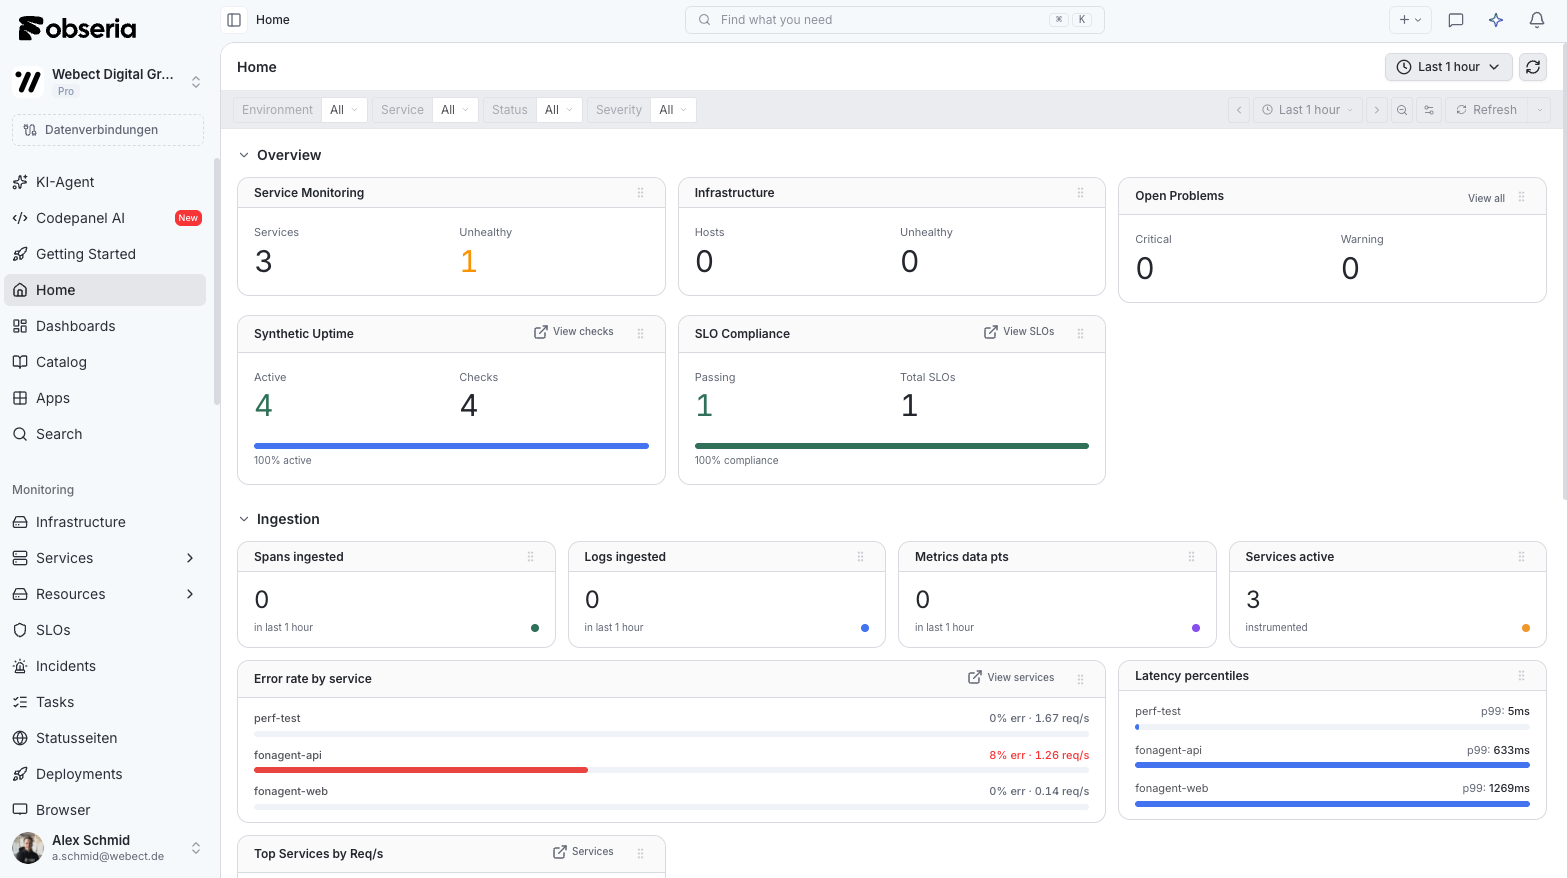
Resolve issues before customers notice
Unified view of metrics, traces, logs, and events
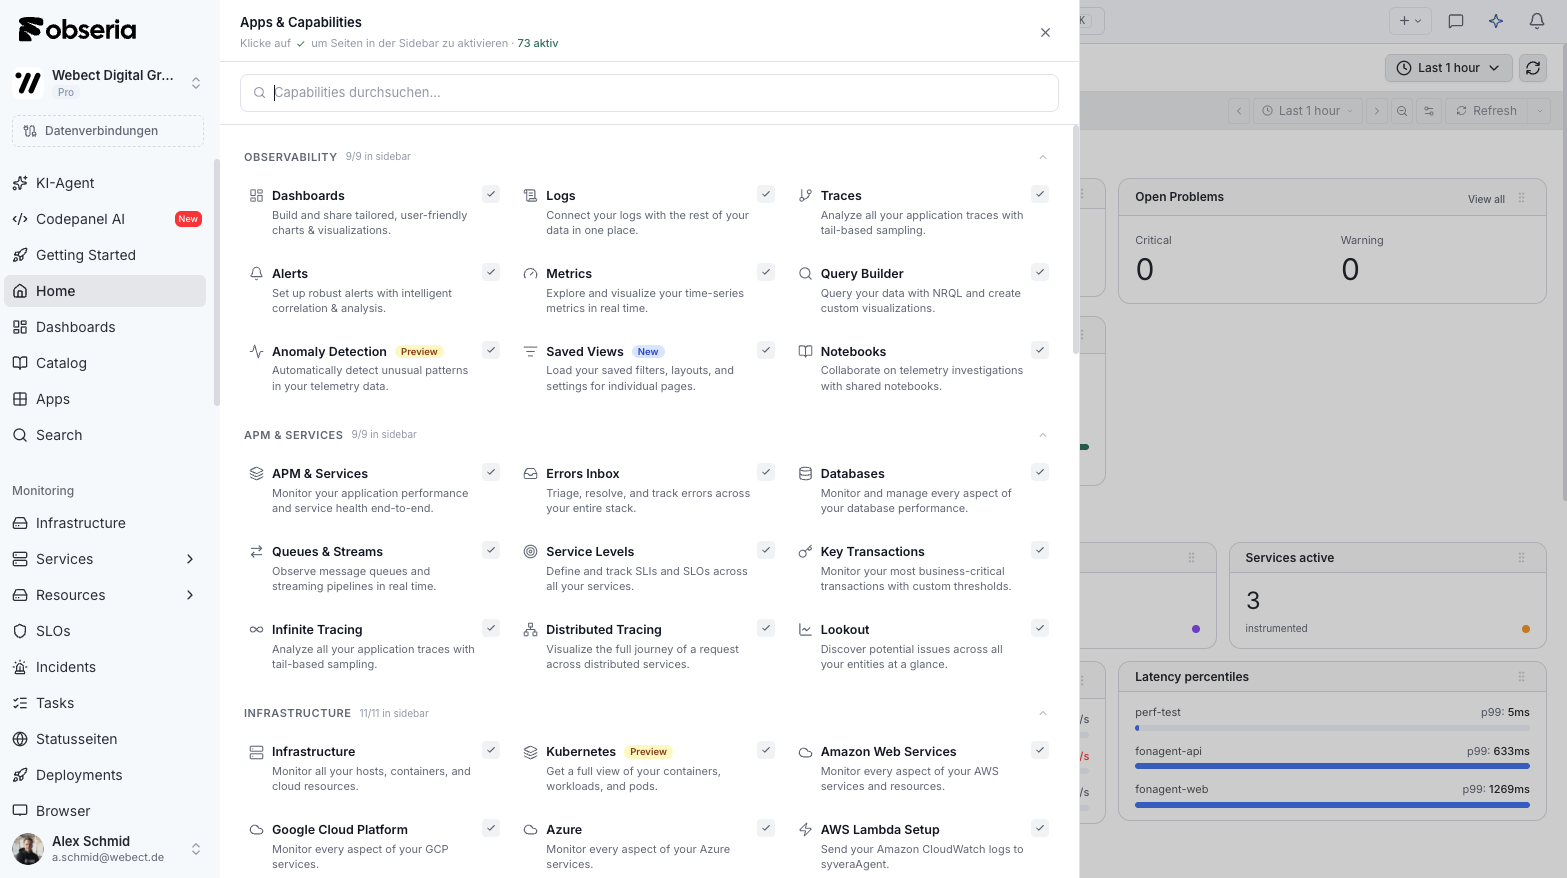
AI that thinks like your SRE team
Automatic anomaly detection without manual thresholds
Search petabytes in milliseconds
Live tail with real-time structured field parsing
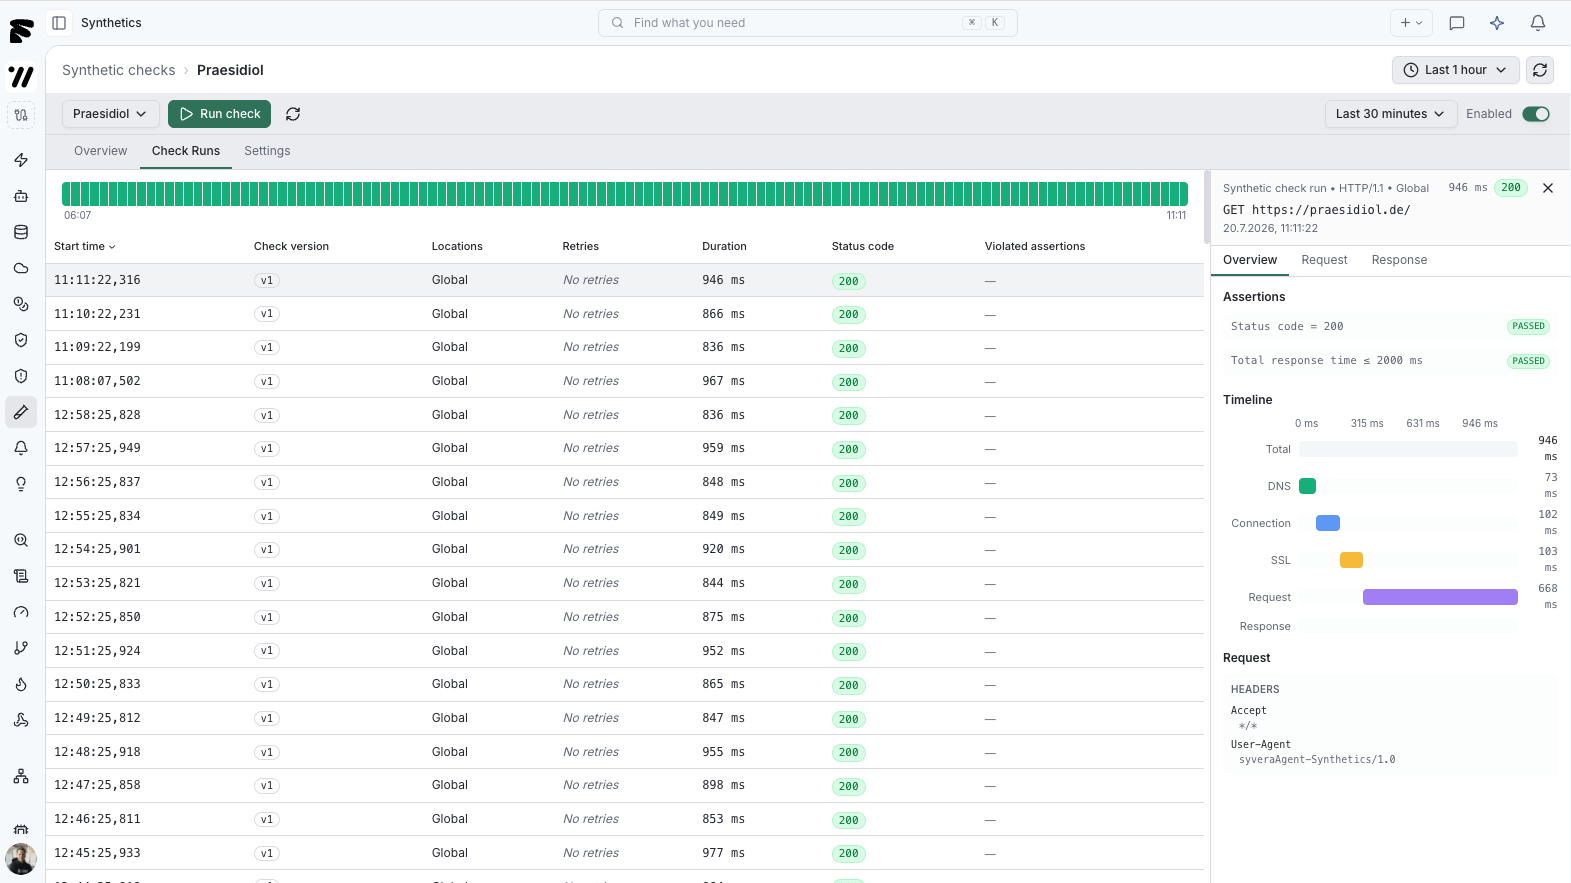
Every metric, every dimension
Unlimited cardinality — no hidden metric plan tiers
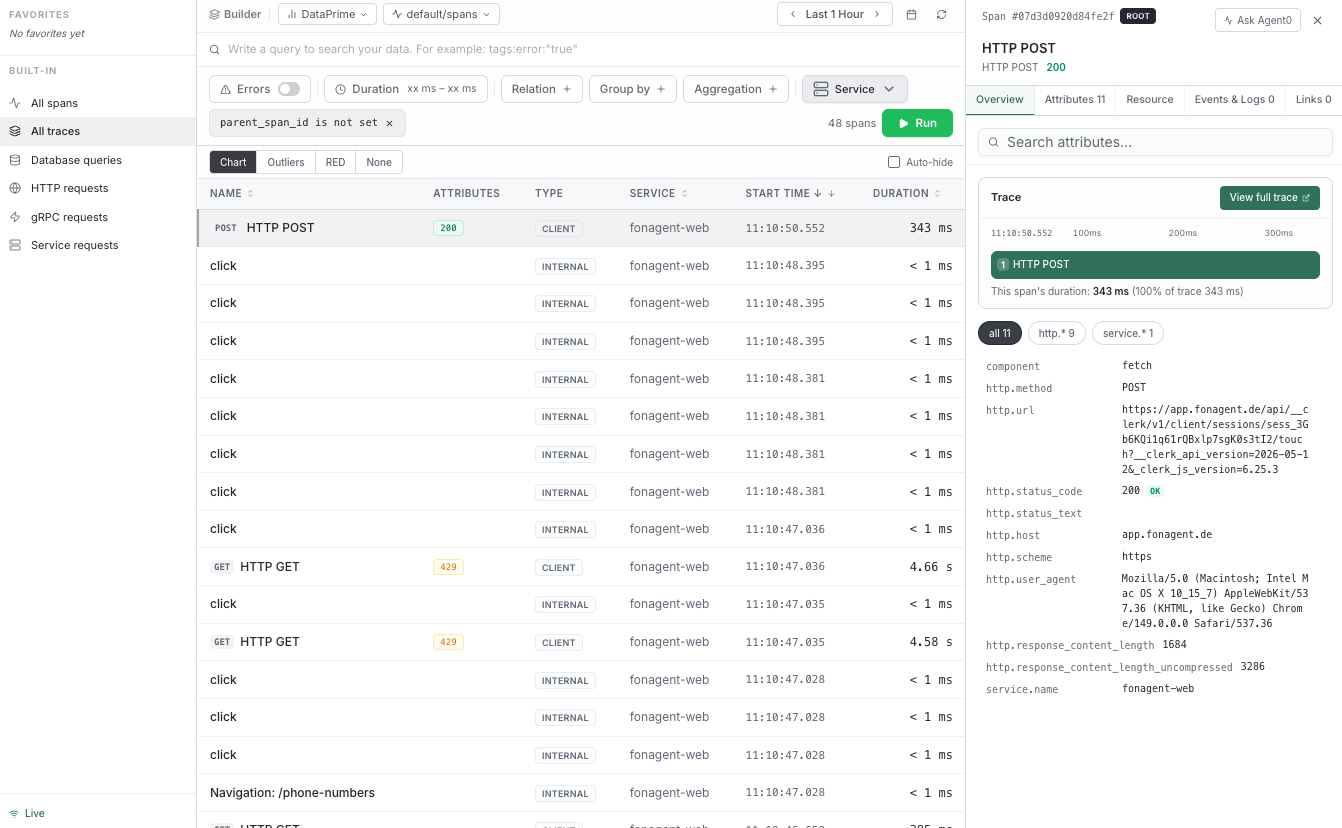
End-to-end distributed tracing
Sub-millisecond span precision across 100+ languages
99.99%
Uptime SLA
<2 ms
Ingestion latency
3,400+
Engineering teams
180+
Integrations
Platform
Everything your stack needs. Nothing it doesn't.
Traces, metrics, logs, alerts, Kubernetes, and uptime monitoring — unified in one platform.
Follow every request, end to end.
Waterfall trace views, automatic span correlation, and service dependency maps — all built on OpenTelemetry. Pinpoint the exact line of code causing slowdowns without sampling.
- Sub-millisecond span precision across 100+ languages
- Automatic service map with error hotspot highlighting
- One-click jump from trace → log → metric context
Platform
Every tool your team needs. Nothing you don't.
Infrastructure
Full-stack visibility. No extra agents.
Kubernetes, VMs, containers, and cloud services unified in one live host map with automatic service discovery.
- Helm deploy in under 5 minutes
- Unified view across AWS, GCP, Azure & bare-metal
- OOMKill & CrashLoop alerts pre-built
ROI · Engineering Efficiency
Economic Impact of obseria.io AI Agent
500 engineers at a global SaaS company — measured results after 90 days
| Use Case | Before obseria.io | With AI Agent | Improvement | Hours Saved / Year |
|---|---|---|---|---|
| Troubleshooting & Root Cause Analysis | 90 min | 60 sec | 90× faster | 18,200 hrs / yr |
| Building Dashboards & Queries | 3 min | 15 sec | 12× faster | 21,610 hrs / yr |
| Writing & Tuning Alert Rules | 5 min | 30 sec | 10× faster | 4,800 hrs / yr |
| Incident Response & Runbooks | 45 min | 3 min | 15× faster | 39,000 hrs / yr |
Estimated total engineering cost saved per year
Based on avg. $110/hr fully-loaded engineering cost · 500 engineers
$4.7 M
per year in reclaimed capacity
AI-powered
Find root cause
before your customers notice.
obseria.io's ML engine continuously learns your traffic patterns. When something deviates, it surfaces the anomaly, clusters related signals, and pinpoints the exact span where things went wrong.
Auto-correlation across metrics, traces & logs
One unified view — no context switching.
Baseline learning with zero config
Starts learning immediately on connect.
One-click span drill-down to root cause
From alert to flamegraph in a single click.
Slack & PagerDuty integration
Get alerted where your team already works.
Error rate — Production
Last 60 minutes
AI root cause identified
productcatalog DB · slow query · 428ms avg · started 14 min ago
See it in action
From alert to root cause
in under 60 seconds.
Watch how obseria.io correlates a spike in error rate to the exact slow database query — without switching tools, without manual log digging.
One click from metric anomaly to offending trace
ML surfaces the deviation, you click once to see the full flamegraph.
Log context loads automatically alongside the span
No copy-pasting trace IDs — the correlated logs are already there.
Fix deployed and verified in the same window
Link your deployment event directly on the timeline.
Error Rate
4.1%
↑ Anomaly detected
Root Cause
productcatalog DB
Slow query · 428ms
Resolved in 47s
Watch the demo
2 min · No signup required
Customers
Trusted by 4,000+ engineering
teams worldwide.
“obseria.io cut our MTTR from 45 minutes to under 3. The correlated traces and logs view is unlike anything else on the market.”
Sarah Chen
VP Engineering · Fluxion Labs
“We evaluated every major APM tool. obseria.io was the only one that didn't make us choose between cost and cardinality.”
Marcus Webb
Staff SRE · Orbit Systems
“The AI alerting actually works. We went from 200+ pages a week to 12 — all of them real. Our on-call team finally sleeps.”
Priya Kapoor
CTO · NovaBridge
Customers
Trusted by engineering
teams at scale.
“obseria.io cut our MTTR from 45 minutes to under 3. The correlated traces and logs view is unlike anything else on the market.”
Sarah Chen
VP Engineering
“We evaluated every major APM tool. obseria.io was the only one that didn't make us choose between cost and cardinality.”
Marcus Webb
Staff SRE
“The AI alerting actually works. We went from 200+ pages a week to 12 — all of them real. Our on-call team finally sleeps.”
Priya Kapoor
CTO
Pricing
Pay only for
what you ingest.
No base fee. No seat minimum. No surprise bills.
Start free for 14 days.
Metric Data Points
per million
Counters, gauges, histograms. Prometheus, OpenTelemetry, or our SDK.
Spans & Span Events
per million
Distributed traces with full flamegraph and waterfall views.
Log Records
per million
Structured and unstructured logs, auto-correlated to traces.
Web Events
per million
Frontend RUM — page loads, interactions, Core Web Vitals, JS errors.
Synthetic Checks
per thousand
Uptime checks from 12 global locations, linked to traces.
Enterprise
Custom
volume pricing
Start with a 14-day unlimited free trial
No credit card required. Full access to every feature from day one.
FAQ
Frequently asked
questions.
Can't find what you're looking for? Reach our team at support@obseria.io
obseria.io is built natively on OpenTelemetry — no proprietary agents, no vendor lock-in. You own your data, ingest it anywhere, and pay only for what you use. Our ML-driven anomaly detection surfaces root cause automatically, instead of flooding you with noise.
Ready to see what's actually happening?
Start for free. No credit card required. Full access to all features for 14 days.