
Security and reliability on one data foundation
Attacks, outages and compliance questions share the same raw material: telemetry. Obseria connects runtime security, audit logs, data protection and availability monitoring so that security and operations teams work from the same facts.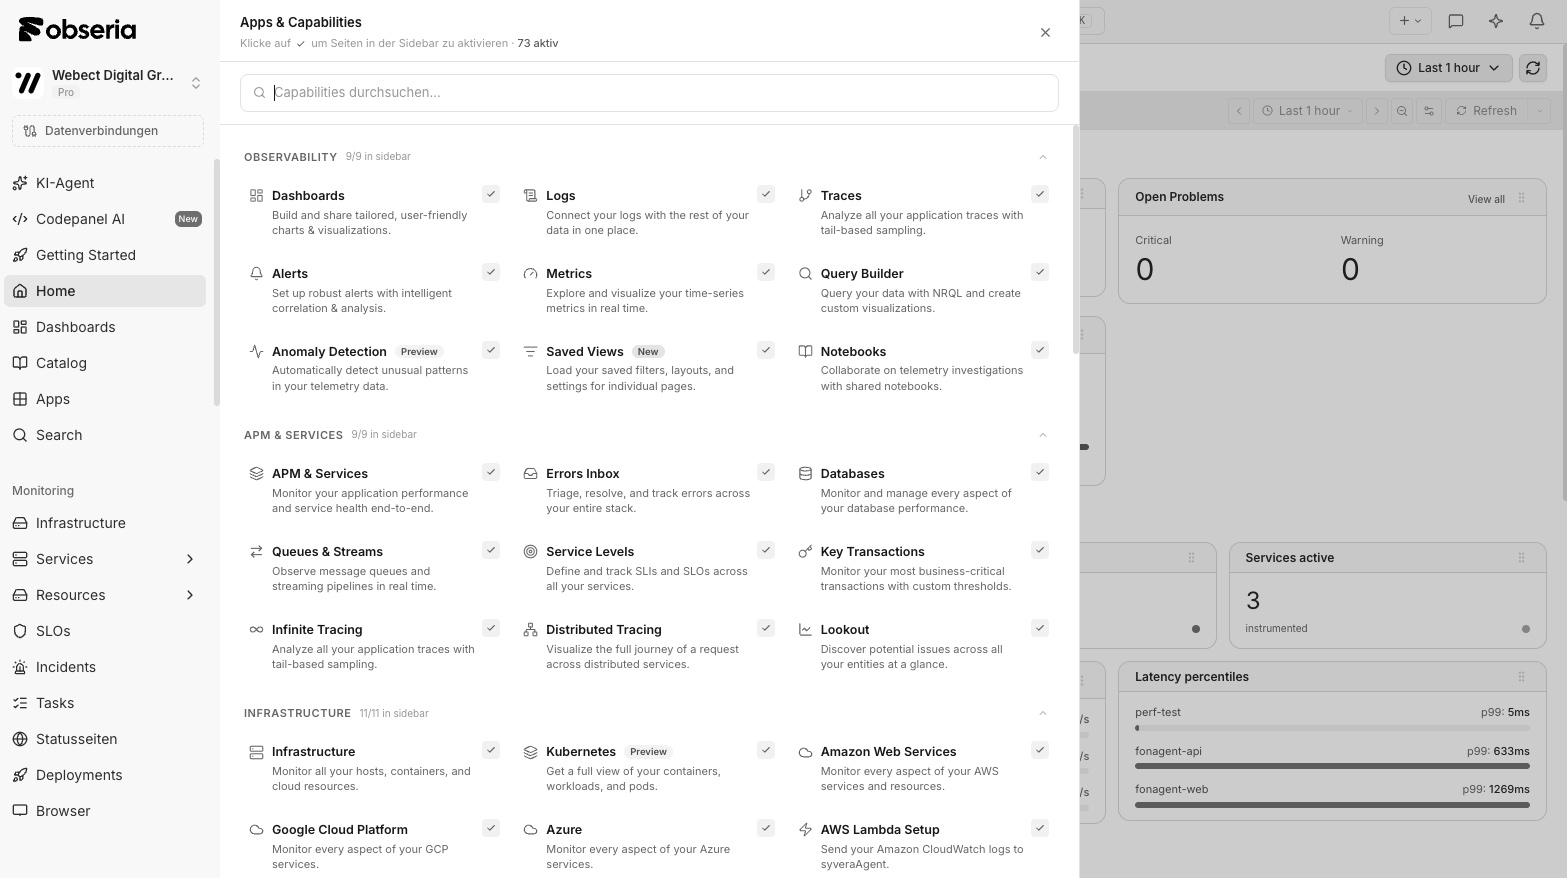
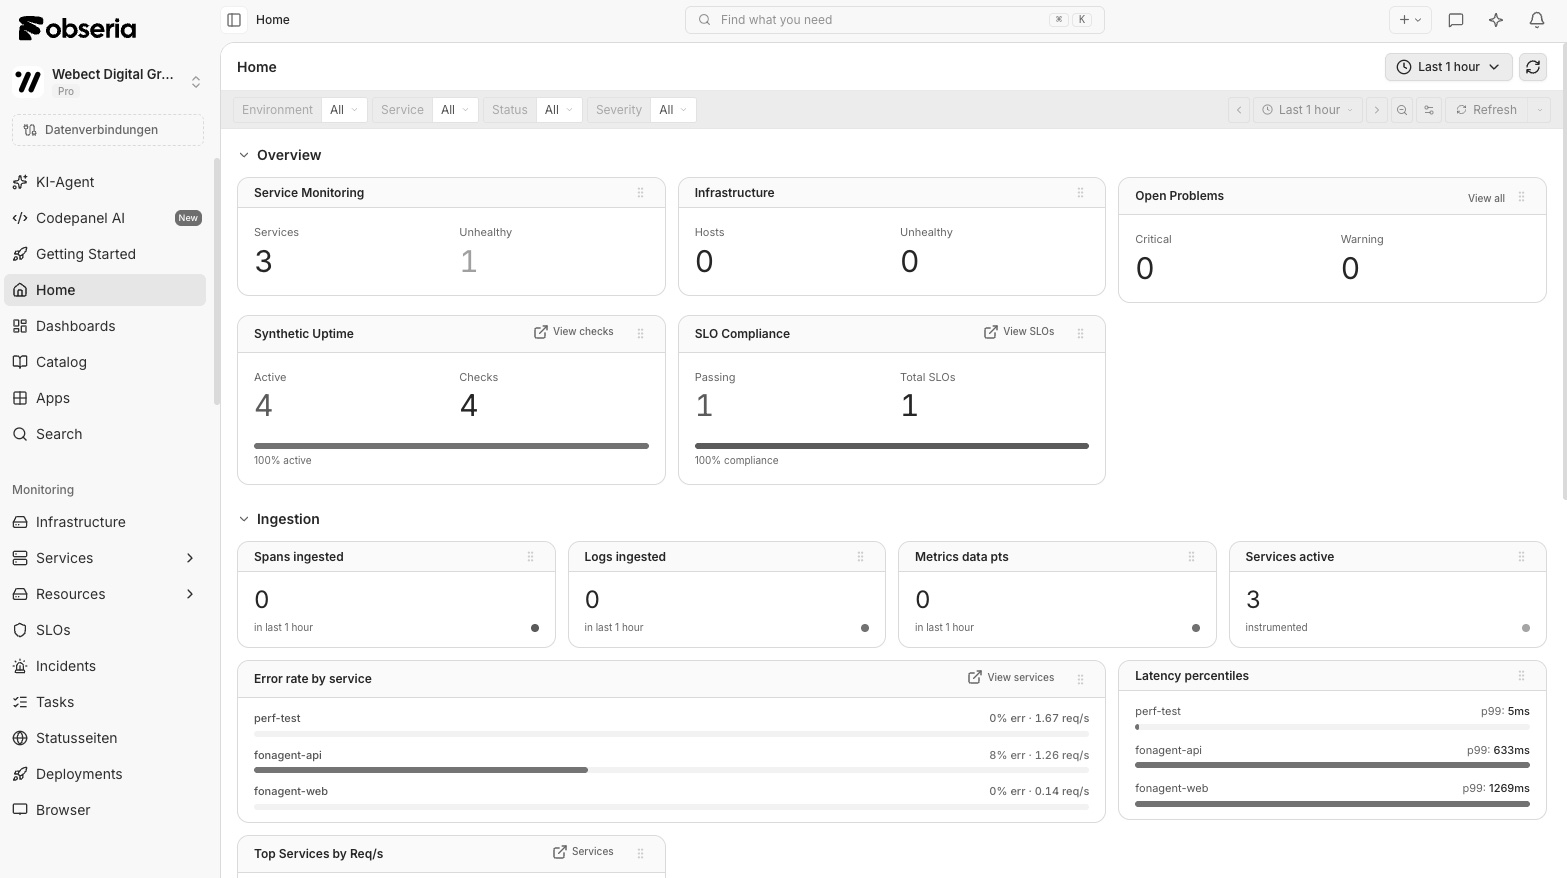
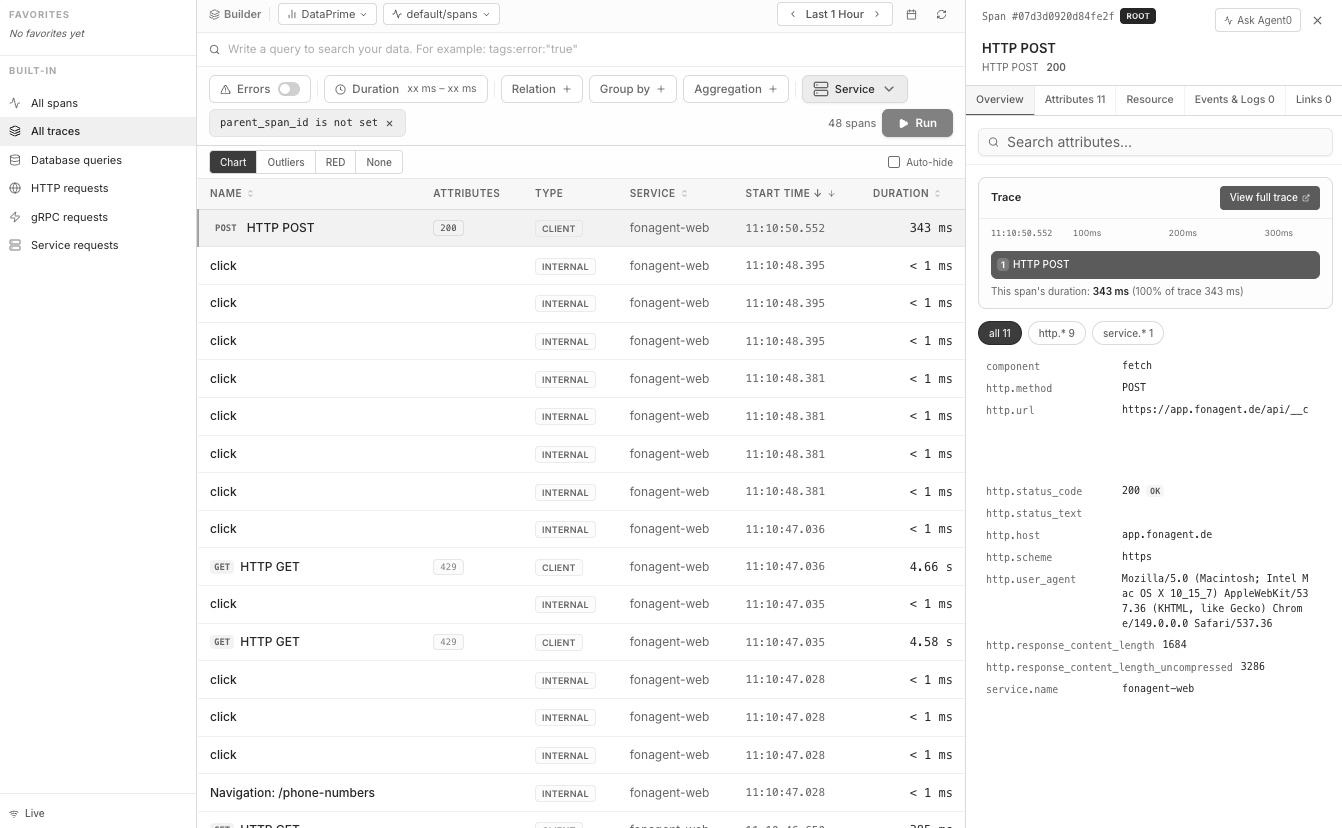














Security and operations see the same incident
A suspicious spike in errors may be a bug, an overloaded dependency or an attack. When security and reliability teams use separate tools, they lose time aligning their view. Obseria gives both the same correlated data.Runtime application security
Detect vulnerabilities and attacks in the running code path, prioritized by reachability and exposure.
Audit logs
Access and configuration changes are logged and can be analyzed alongside operational telemetry.
PII masking
Obseria Pipeline masks personal data before storage, so sensitive values never reach long-term storage.
Incident documentation
Timelines and evidence support internal reporting obligations under frameworks such as NIS2 and DORA.
EU data residency
Telemetry is stored in the EU, which simplifies data protection assessments.
High availability
Synthetic checks, SLOs and topology show early when redundancy or failover is at risk.
Prioritize vulnerabilities by real risk
Scanners report long lists of CVEs, but only a fraction of them are reachable in production. Obseria uses runtime context to answer the questions that matter: is the vulnerable library actually loaded, is the process reachable from the internet, does it touch sensitive data? Attacks such as SQL injection, command injection or SSRF are detected in the code path and can optionally be blocked, with the full trace of the request for investigation.
- Vulnerability scoring by reachability and exposure
- Detection of injection and SSRF attacks at runtime
- Full request traces for security investigations
- Findings routed to the team that owns the code
Mask personal data before it is stored
Logs and traces often contain more than intended: email addresses, IP addresses, tokens or payment data in error messages. Obseria Pipeline processes telemetry before storage. Rules hash, redact or truncate sensitive fields, and routing sends audit-relevant events to dedicated destinations with their own retention. Because masking happens in the pipeline, the protection applies to every signal and every downstream consumer, including AI analysis.
- Hashing, redaction and truncation of sensitive fields
- Pattern-based detection of common personal data
- Separate routing and retention for audit events
- Telemetry stored in the EU
# Obseria Pipeline: mask personal data before storage
processors:
  mask/pii:
    rules:
      - field: attributes["user.email"]
        action: hash
      - field: body
        pattern: '\b\d{4}[ -]?\d{4}[ -]?\d{4}[ -]?\d{4}\b'
        action: redact
      - field: attributes["client.address"]
        action: truncate_ip
routes:
  - match: attributes["log.type"] == "audit"
destination: lake/auditSupport for detection, documentation and reporting
Regulations such as NIS2 and DORA require organizations to detect significant incidents, analyze their cause and impact and report within defined deadlines. Obseria does not make you compliant on its own, and it does not replace legal advice. It does provide technical building blocks: continuous monitoring, incident timelines with timestamps, severity classification, evidence from logs and traces, and audit logs of access and configuration changes. These records make it easier to prepare internal and regulatory reports.
- Incident timelines with timestamps and evidence
- Severity classification and impact on services
- Audit logs of access and configuration changes
- Exportable data for internal and regulatory reports
Detect risks to availability before they become outages
Redundancy only helps if you know it is working. Obseria monitors replicas, zones and failover paths through TopoGraph, synthetic checks from outside and SLOs that reflect what users experience. Saturation trends and capacity signals show when a cluster is running out of headroom. When a component fails, the topology makes the blast radius visible immediately, and status pages inform customers while the team works on recovery.
- Synthetic checks from outside your network
- Topology view of replicas, zones and dependencies
- Saturation and capacity trends with 13 months of metrics
- Status pages for transparent communication
Recover faster and prove what happened
Business continuity plans describe how critical services are restored after a disruption. Observability turns these plans into something you can test and verify. Obseria links business-critical services to their technical dependencies, measures recovery times from real incidents and keeps a documented history of every disruption. Runbooks in Obseria Automation encode recovery steps, and the AI agent can propose them during an incident, acting only after approval.
- Critical services mapped to their dependencies
- Recovery times measured from real incidents
- Runbooks for documented recovery procedures
- History of disruptions for reviews and audits
Frequently asked questions
No tool can do that on its own. Compliance depends on your organization, processes and legal assessment. Obseria provides technical building blocks such as continuous monitoring, incident timelines, audit logs and exportable evidence that support detection, documentation and reporting. Please consult your legal and compliance teams for binding requirements.
Obseria Pipeline processes telemetry before it is stored. Rules can hash, redact or truncate fields and detect common patterns in log messages. Because masking happens before storage, the protected values are not available in long-term storage or in downstream analysis.
Obseria offers EU data residency. Details on locations, subprocessors and data processing can be found on the security and trust page and in the data processing agreement.
Runtime security analysis runs in the existing Obseria Agent, so no additional per-host installation is required. Findings appear in the same platform as traces, logs and metrics.
Audit logs record access and configuration changes in the platform. They can be analyzed in Obseria Lake with the same query languages as operational data and routed to separate destinations with their own retention.
Synthetic checks test availability from outside, SLOs measure what users experience and TopoGraph shows replicas, zones and dependencies. Together they reveal when redundancy is degraded before a single further failure leads to an outage.
Yes. Access can be controlled per team, data set and field, so security analysts, SREs and developers see the data they need for their role. Everyone works on the same underlying telemetry, which avoids duplicate pipelines, while sensitive fields such as audit details remain restricted to the people who are allowed to see them.
When an attack or a suspicious pattern is detected, the incident timeline collects the relevant traces, logs and audit events in one place. Investigators can follow a request from the entry point through every service it touched and see which data was involved. The same timeline later serves as documentation for internal reviews and, where required, for reporting.
No. Customer data is not used to train AI models. AI analysis in Obseria works on telemetry that has already passed through Obseria Pipeline, so masked fields remain masked for the AI as well, and findings come with a chain of evidence your teams can review.
Yes. Routing rules in Obseria Pipeline can send audit-relevant events to separate destinations with their own retention. That way you keep the records you need for reviews and audits without storing every debug log for the same period.
Security and reliability, one view.
Talk to us about runtime security, data protection and availability monitoring for your critical services.