
Consolidate your monitoring tools into one platform
APM in one tool, logs in another, infrastructure, frontend and synthetic checks somewhere else: Obseria brings all signals together on one OpenTelemetry-native platform with one data model, one query experience and one usage-based price.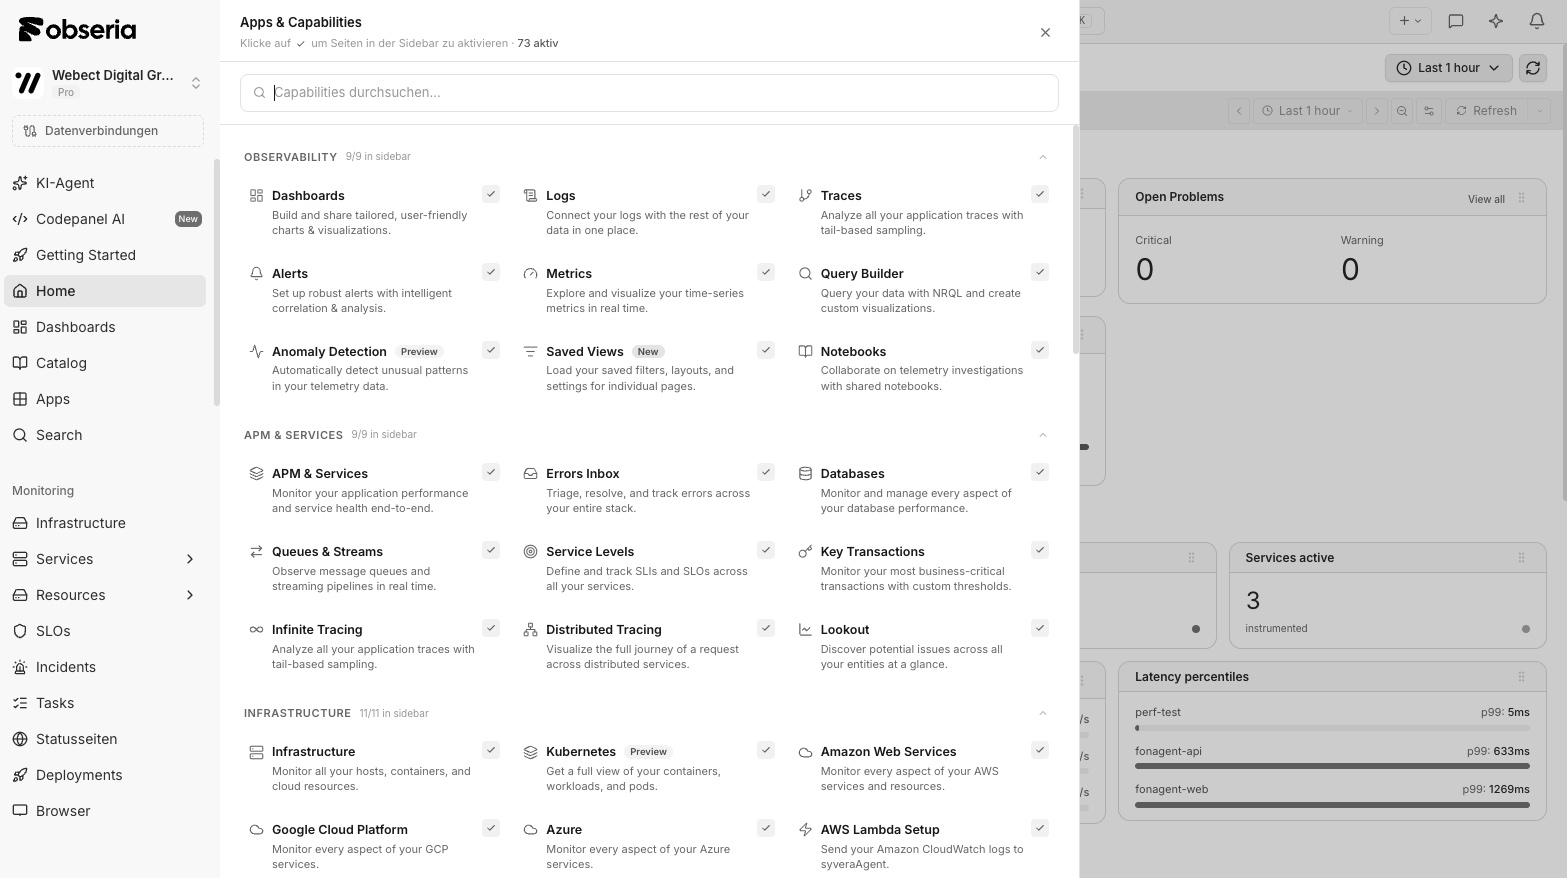














Fewer tools, fewer handoffs, clearer cost
Every additional monitoring tool adds a contract, an agent, a query language and a place where context gets lost. Consolidation removes that friction without forcing a big-bang migration.One data model
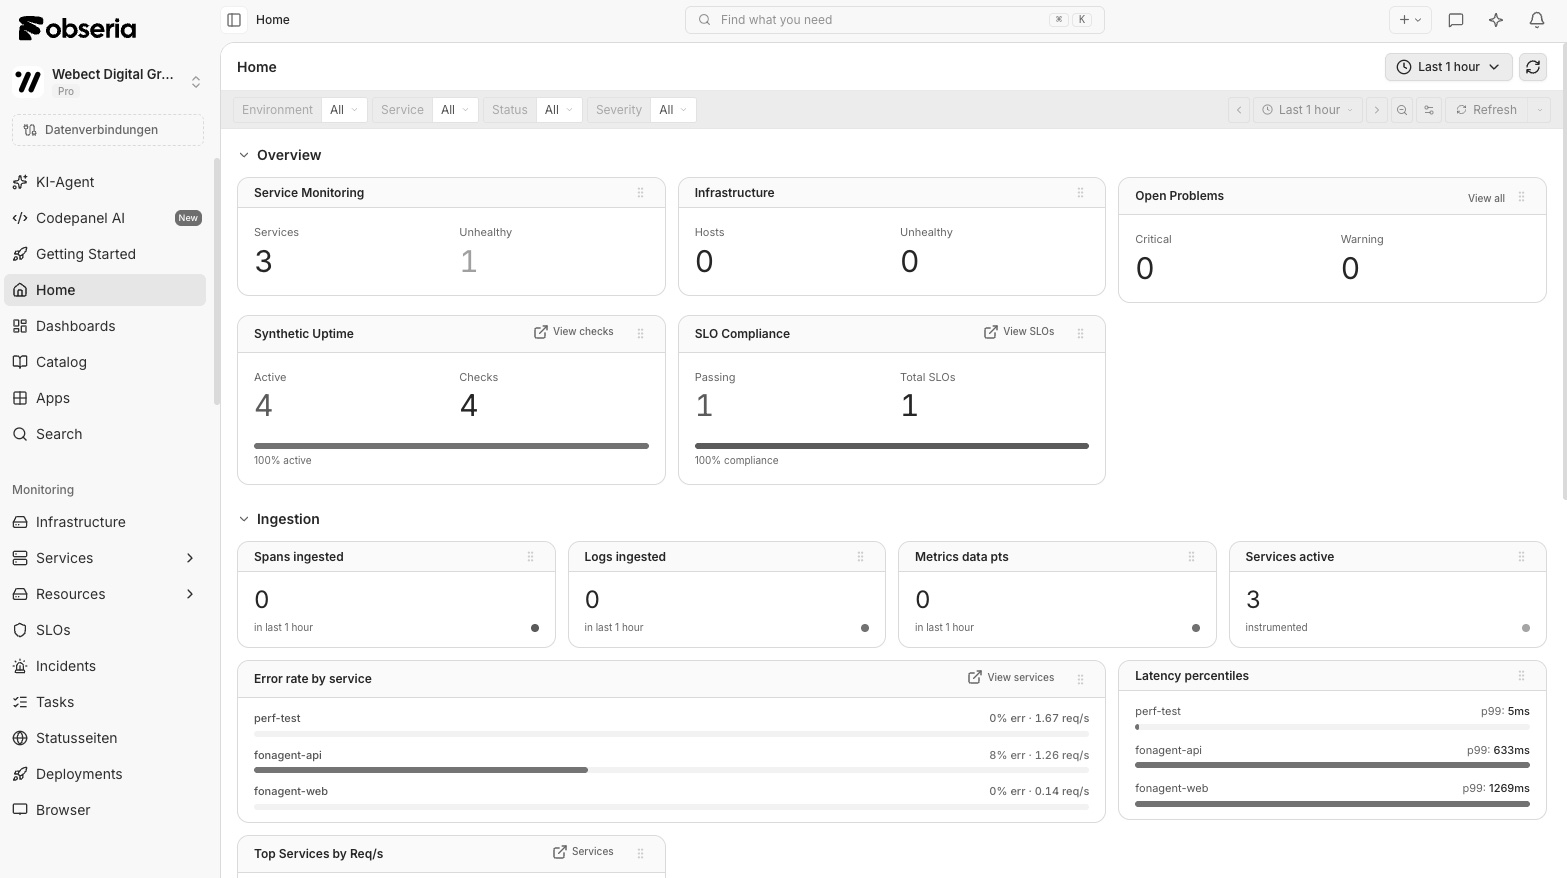
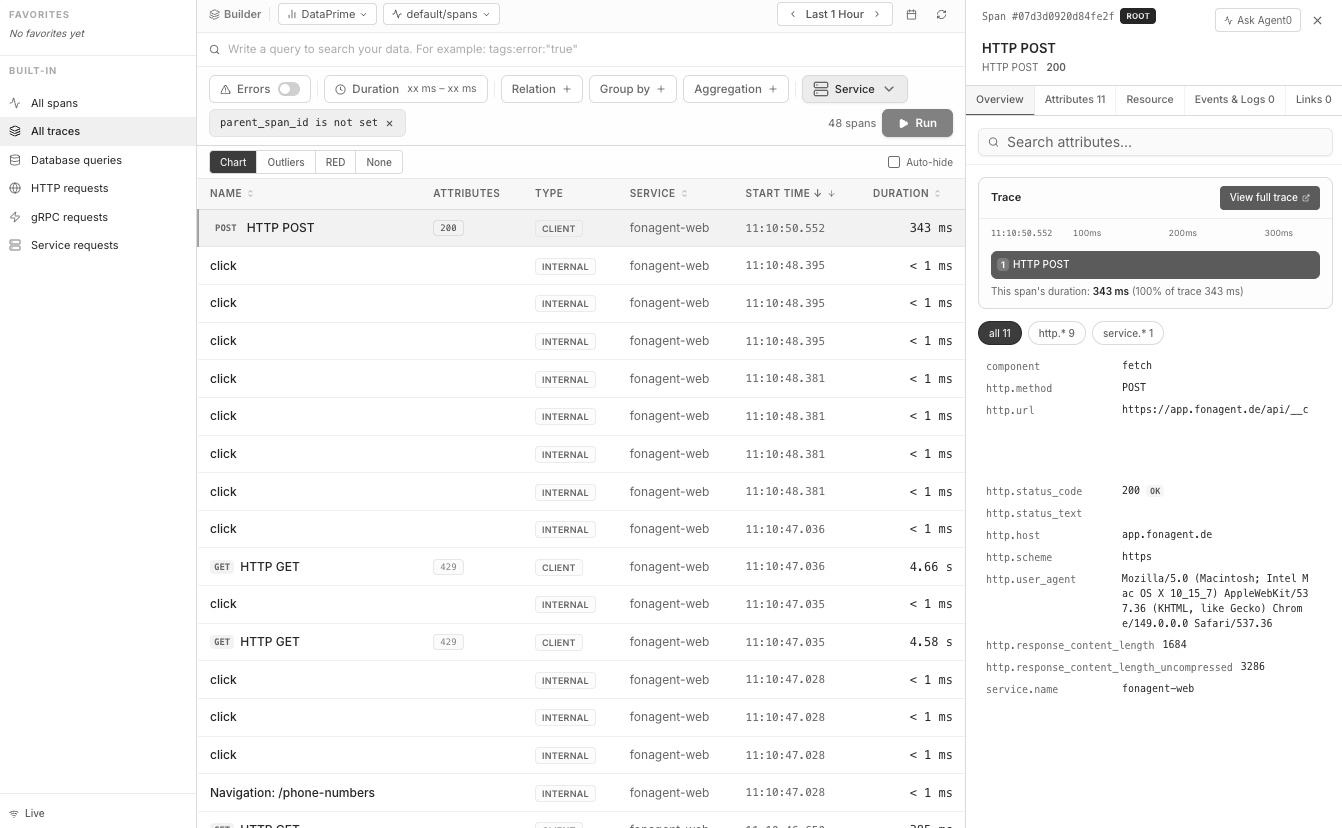
Logs, metrics, traces and events land in Obseria Lake and stay correlated, so a trace, its logs and the affected host are one click apart.
OpenTelemetry-native
Keep your OTel SDKs and Collectors. Obseria accepts OTLP and Prometheus remote write, so most instrumentation needs no change.
Lower total cost
Usage-based pricing per signal and unlimited users replace several license models built on hosts, seats or indexed volume.
One query experience
PromQL, OQL and SQL across all signals instead of one proprietary syntax per tool.
Gradual migration
Run Obseria in parallel to existing tools, compare coverage and retire legacy tools on your own schedule.
Context across layers
TopoGraph maps services, hosts and dependencies automatically, so frontend, backend and infrastructure share one picture.
Tool sprawl costs more than the license fees
Most teams did not plan their monitoring landscape, it grew. An APM vendor for backend services, a log platform priced by indexed gigabytes, a separate infrastructure tool, a frontend product for real user monitoring and yet another service for synthetic checks. Each tool works on its own, but during an incident engineers jump between tabs, copy timestamps and try to match IDs that were never designed to match. The hidden costs are onboarding, duplicated agents, separate alerting rules and the time lost when context is spread across systems.
- Several contracts, renewal dates and pricing models to manage
- Duplicate agents and collectors on the same hosts
- Alert rules maintained in multiple places with different semantics
- Incident context split across tools that do not share IDs
All signals in one place, correlated by default
Obseria stores logs, metrics, traces and events in Obseria Lake, an index-free store with schema-on-read. Because every signal follows OpenTelemetry semantic conventions, a slow span links to its logs, its host metrics and the frontend sessions it affected. TopoGraph builds the service topology automatically, and Obseria Intelligence uses this shared context for causal root-cause analysis with a chain of evidence your engineers can review.
- APM, distributed tracing and error tracking
- Log analytics without index management
- Infrastructure, Kubernetes and cloud monitoring
- Real user monitoring and synthetic checks
- Metric retention of 13 months for trend analysis
One pricing model that follows your data, not your org chart
Consolidation only pays off if the new pricing is easier to predict than the old ones combined. Obseria charges per signal ingested and stored, with unlimited users and no host or seat fees. Obseria Pipeline filters, samples and aggregates telemetry before storage, so noisy debug logs or redundant metrics do not end up on your invoice. Use the cost calculator to estimate your environment, and compare the result with what you pay across your current tools today.
- Usage-based pricing per signal, unlimited users
- Filtering, sampling and aggregation before storage
- No separate licenses for APM, logs, RUM or synthetics
- Fewer agents to deploy, patch and operate
Consolidate step by step, without a blind spot
You do not have to switch everything at once. Because Obseria is OpenTelemetry-native, you can add Obseria as an additional exporter in your existing Collector and send the same data to both destinations. Teams compare dashboards and alerts side by side, migrate service by service and switch off a legacy tool only when coverage is confirmed. Dashboards, alerts and SLOs can be managed as code, which makes the conversion repeatable.
- Dual shipping via the OpenTelemetry Collector
- Service-by-service migration with clear acceptance criteria
- Dashboards, alerts and SLOs as code
- Hands-on help from Obseria engineers during the switch
From tool inventory to a single platform
- Step 1
Inventory
List the tools in use, which teams rely on them, which signals they cover and what they cost today.
- Step 2
Connect
Add Obseria as an OTLP exporter or Prometheus remote-write target and ship data in parallel to your current stack.
- Step 3
Validate
Rebuild critical dashboards and alerts, compare results over real incidents and agree when coverage is complete.
- Step 4
Retire
Switch off legacy tools one by one and remove their agents, contracts and duplicate alert rules.
Today's tool stack and what replaces it in Obseria
| Today | Typical setup | Obseria capability |
|---|---|---|
| APM | Proprietary agent per language, priced per host | Application observability and distributed tracing on OpenTelemetry |
| Logs | Log platform priced by indexed volume | Log analytics in Obseria Lake, index-free with schema-on-read |
| Infrastructure | Separate tool for hosts, containers and cloud services | Infrastructure, Kubernetes and cloud monitoring with TopoGraph |
| Metrics | Self-operated Prometheus with limited retention | Prometheus remote write, PromQL and 13 months of metric retention |
| RUM | Frontend product with its own session pricing | Real user monitoring and session replay in the same data model |
| Synthetics | Standalone uptime and browser check service | Synthetic monitoring and status pages |
| Incidents | Separate on-call and incident tool | Alerting, SLOs and incident management on the same signals |
Frequently asked questions
Obseria covers application performance monitoring, distributed tracing, log analytics, infrastructure and Kubernetes monitoring, real user monitoring, synthetic checks, alerting, SLOs, incident management and status pages. Which tools you retire depends on your setup; many teams start with APM and logs because that is where context gets lost most often.
Usually not. If you already use OpenTelemetry SDKs or the Collector, you add Obseria as an OTLP exporter. Prometheus metrics arrive via remote write. Proprietary agents can be replaced gradually with OpenTelemetry instrumentation or the optional Obseria Agent.
Yes. The OpenTelemetry Collector can send the same telemetry to several destinations. This lets you compare dashboards and alerts side by side and switch off a legacy tool only once coverage is confirmed.
Add up licenses, agents, infrastructure for self-operated tools and the engineering time spent on maintenance. Then estimate Obseria with the cost calculator. Because pricing is usage-based per signal with unlimited users, the result mainly depends on how much data you keep after filtering in Obseria Pipeline.
Companies moving from Datadog, Dynatrace or New Relic can apply for a credit on the usage-based fees of their first three billing months, plus hands-on migration help from Obseria engineers. Eligibility and limits are described in the terms on the switch bonus page.
Obseria is built on OpenTelemetry, so your instrumentation stays vendor-neutral. Data can be exported via OTLP, and queries use open languages such as PromQL and SQL alongside OQL.
That depends on the number of tools, services and teams involved. Because Obseria can run in parallel, there is no fixed cutover date. Many organizations start with one team or one signal type, validate the result over a few real incidents and then continue service by service. The pace is set by your own acceptance criteria, not by a vendor deadline, and legacy tools are switched off only once their coverage has been replaced.
Critical dashboards and alert rules are rebuilt in Obseria, ideally as code so that the conversion is reviewable and repeatable. Prometheus-based dashboards and PromQL alert rules can usually be reused with little change. Proprietary queries need to be translated to PromQL, OQL or SQL. During the parallel phase you can compare the old and the new alerts directly and adjust thresholds before the switch.
Historical data stays in your current tools until you retire them. Obseria starts collecting from the moment you connect it, and metric retention is 13 months, so a full year of history builds up quickly during the parallel phase. If you need older data for audits, plan to export it from the legacy tool before the contract ends.
A consolidation works best when platform or SRE teams, the service owners and whoever manages the tool budgets are involved from the start. Platform teams own the Collector configuration and pipelines, service owners validate dashboards and alerts, and budget owners compare the total cost. Unlimited users in Obseria mean that everyone can take part without discussing additional seats.
One platform instead of five tools.
Connect your existing OpenTelemetry setup and compare Obseria with your current stack, in parallel and without risk.